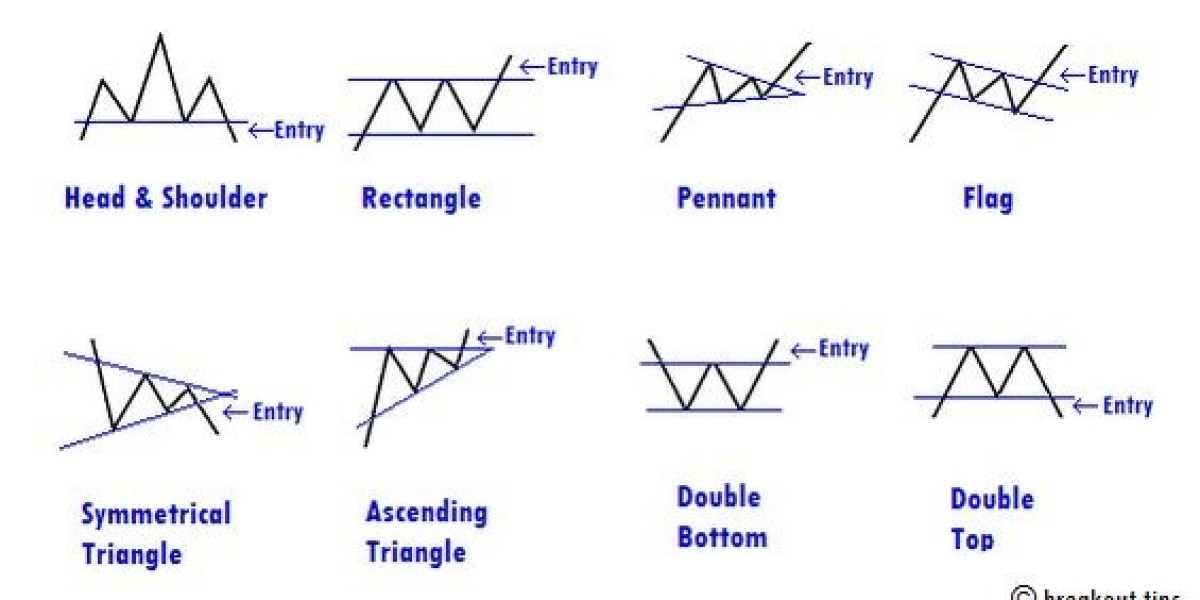
Have you ever looked at a stock chart and wondered, "What does this mean?" or "Is there a pattern here?" If so, you’re not alone. Chart patterns are visual representations of price movements and can help traders make sense of the markets. Let’s dive into this fascinating world and see how chart patterns can offer valuable insights into future trends.
What Are Chart Patterns?
Chart patterns are shapes and formations found on financial charts that help traders predict future price movements. Think of them as road signs that tell you whether to keep moving forward, slow down, or change direction.
Why Are Chart Patterns Important?
Chart patterns are essential because they can offer clues about the market's direction. They allow traders to analyze historical price action and make educated guesses about where the market might go next. By learning these patterns, you gain an extra tool to help you navigate the sometimes unpredictable world of trading.
Types of Chart Patterns
There are two main types of chart patterns: continuation patterns and reversal patterns. Understanding these two categories is the key to interpreting market trends.
- Continuation Patterns: These suggest that the price movement will continue in its current direction.
- Reversal Patterns: These signal that a change in direction is likely to occur.
Common Chart Patterns
Let's explore some of the most common chart patterns that you’ll encounter in trading. Each pattern tells a different story about the market’s psychology, and knowing these stories can help you make more informed trading decisions.
Understanding Continuation Patterns
Continuation patterns occur when a trend takes a temporary pause before resuming in the same direction. They can be helpful in confirming that the price will continue to move in the way it’s currently heading. Some popular continuation patterns include:
- Flags
- Pennants
- Rectangles
Introduction to Reversal Patterns
Reversal patterns signify a change in the prevailing trend. If a stock is in an uptrend and forms a reversal pattern, it might indicate that a downtrend is about to begin, and vice versa. Common reversal patterns include:
- Head and Shoulders
- Double Top
- Double Bottom
How to Read Chart Patterns?
Reading chart patterns takes a bit of practice. The key is to focus on the shape and the context of the pattern. Are there signs of strength or weakness? How do volume levels align with the price action? These are all factors that contribute to the effectiveness of your pattern analysis.
Popular Patterns to Know
Several chart patterns are widely recognized due to their reliability. In this section, we’ll discuss some of these patterns and how they can impact trading strategies decisions.
Head and Shoulders Pattern
The Head and Shoulders pattern is a reversal pattern that appears at the end of a trend. It consists of three peaks: the highest in the middle (the head), flanked by two lower peaks (the shoulders). This pattern is popular for its ability to signal a trend change, often from bullish to bearish.
Double Top and Double Bottom Patterns
The Double Top is a bearish reversal pattern that signals a potential downtrend. It forms when the price hits a high level twice, creating a ‘M’ shape. Conversely, the Double Bottom is a bullish reversal pattern and forms a ‘W’ shape, indicating a possible uptrend.
Triangle Patterns: Ascending, Descending, and Symmetrical
Triangles are continuation patterns that reflect a pause before the price resumes its direction. There are three main types:
- Ascending Triangle: Bullish pattern with higher lows and a flat upper trendline.
- Descending Triangle: Bearish pattern with lower highs and a flat bottom trendline.
- Symmetrical Triangle: Neutral pattern where both highs and lows are converging.
The Cup and Handle Pattern
The Cup and Handle is a bullish continuation pattern that resembles a teacup with a handle. It signifies a consolidation period followed by a potential upward trend. Traders often see this as a buying signal.
Chart Patterns in Real-Life Scenarios
Chart patterns are used by traders in real-life situations to predict market movements. For instance, when a well-known company reports a significant profit, you may see an uptrend and a continuation pattern like a flag or pennant. Or, if bad news emerges, a reversal pattern may appear.
Conclusion
Understanding chart patterns is like learning a new language. Once you’re fluent, you’ll gain valuable insights that can help guide your trading decisions. Chart patterns are a useful tool for anyone looking to better understand the markets.


